DAX-JUNGLE: UseRelationship
It’s a jungle out there
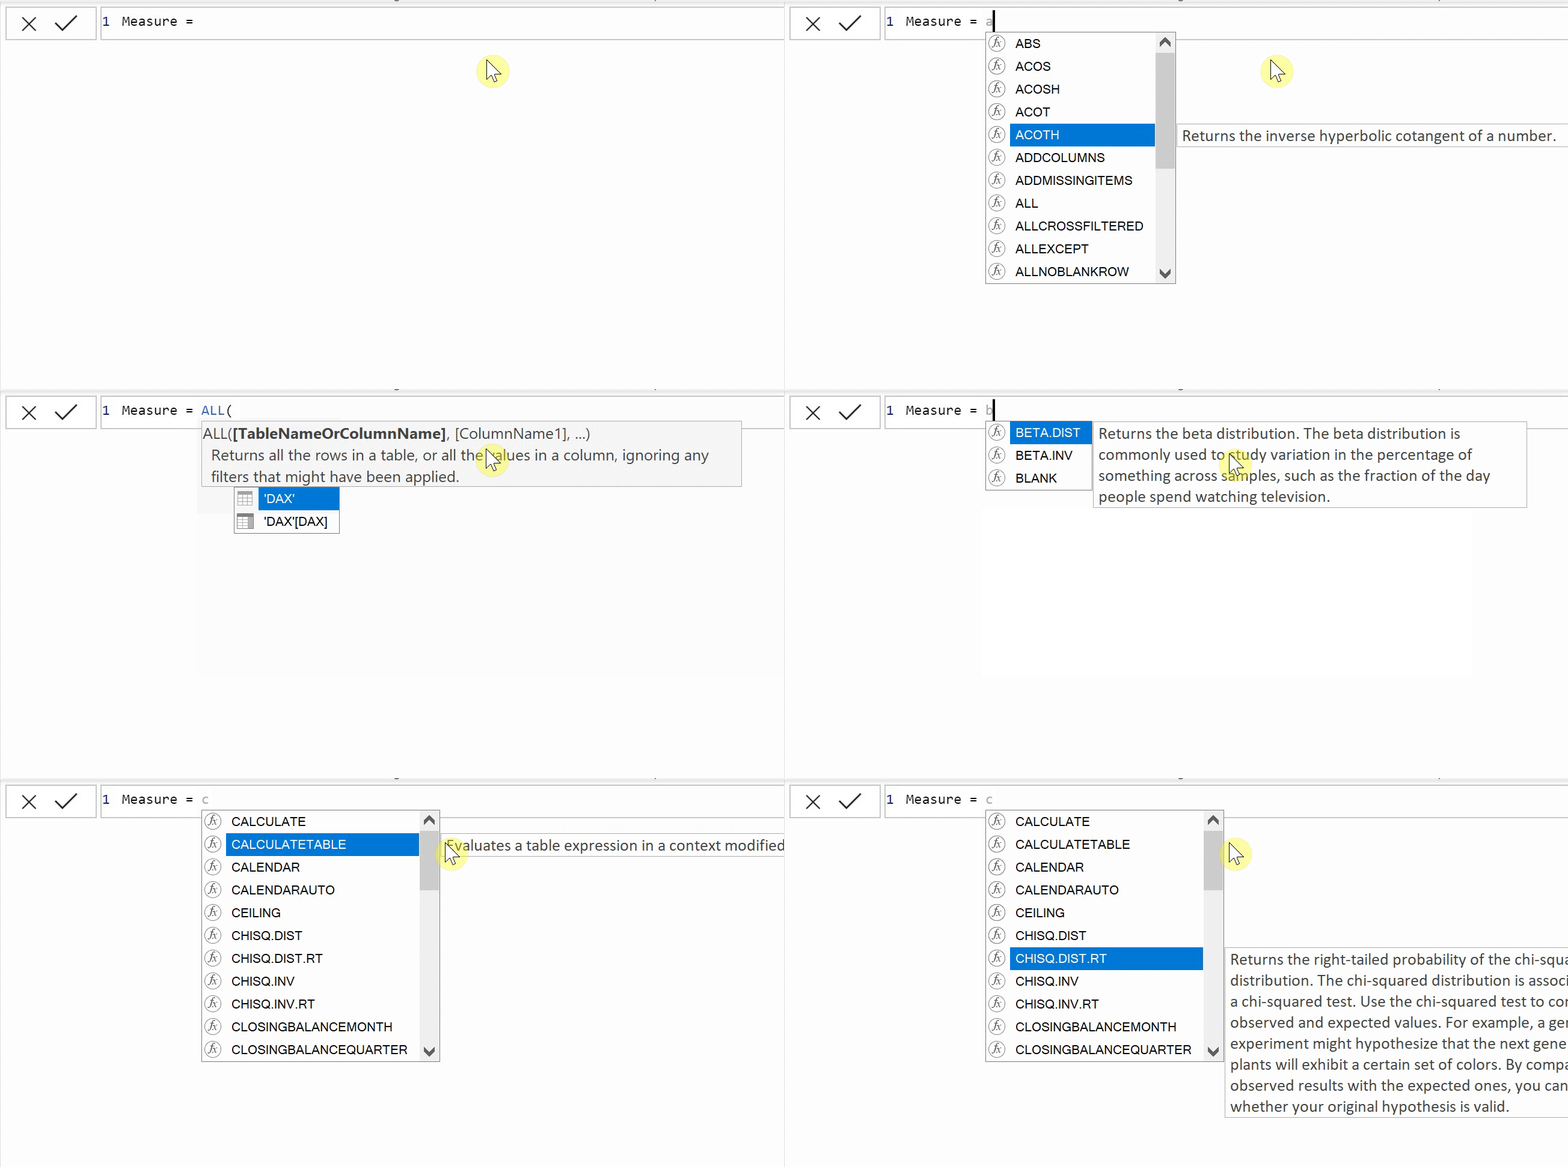
Back in the day- when I was stuck on a DAX problem, I used to toggle through the IntelliSense in PowerBI one letter at a time. I won’t lie, it was pretty dumb.
A:
ABS
ACOS
ACOSH
…
B:
BETA.DIST
BETA.INV
BLANK
Etc….
Hours wasted..
Mistakes were made
A MUCH better use of my time would have been reviewing quality solutions to real world problems.
So that’s what we’ll do. Real problems, real DAX.
The Basics: Userelationship
According to Microsoft Themselves, Userelationship:
“Specifies the relationship to be used in a specific calculation as the one that exists between columnName1 and columnName2.”
This function takes two endpoints of a relationship, active or inactive and forces your measure to use that relationship, rather than any other relationship present between those two tables.
USERELATIONSHIP(‘Table1’[Column1], ‘Table2’[Column2])
This function can be used anywhere that takes a filter context, such as in the second half of a CALCULATE.
Lets look at some examples of how we can use this.
Example 1: Prior Year
In this example we are given a table with sales information by fiscal period.
We also have a fiscal calendar table containing Period, and its respective parts..
Our goal is to find a simple and intuitive way to utilize the USERELATIONSHIP function to calculate a Prior Year measure.
The first step is create a prior year period column on our calendar table. (We can simply subtract 100 to reduce the 3rd digit in this example)
Low lets create our relationships. As a starting point we have a relationship between the two Period columns in our two tables.
Now lets create a new relationship from PY Period to Period. Notice that any relationships we create after the first will have dotted lines; this indicates that they are inactive, this is good.
Now we write a measure to leverage this inactive relationship.
PY Sales = CALCULATE(sum(sales[Revenue]),USERELATIONSHIP('Periods'[PY Period],sales[Period]))
With this measure created we can validate by creating a simple visual. Note the end points of our range
Why is this example useful? Simplicity, and speed:
Using this method to establish prior year calculations keeps things simple. I’ve worked with countless Power BI projects where prior year metrics were calculated using logic such as:
FILTER(ALL(PERIODS),MAX(Periods[Fiscal Year])+1 = Periods[Fiscal Year])….
Its not pretty…
Secondly, we’ve experienced specific cases using large tables with many, many relationships, where using USERELATIONSHIP to avoid these “filter all” clauses increased report performance by a VERY large margin.
If you are struggling with report performance and need PY metrics, this might be a good trick to try.
Example 2: Different Axes
Next up, a straight forward example of when to USERELATIONSHIP, is when you may have multiple ways to relate to one table.
Lets look at an example using the same sales data as our last and a Calendar table.
We want to display sales by Sale Date, AND sales by Ship Date on the same axis.
We can fix this with DAX!
First lets create our base relationship between Sales Date and our calendar, then lets create our second, inactive relationship between Ship Date and our calendar table.
Next up we’ll write a simple measure to leverage this.
Sales by Ship Date = CALCULATE(SUM(sales[Revenue]),USERELATIONSHIP('Calendar'[Date],sales[Ship Date]))
It really is that easy.
We’ll go ahead and create a visual with our calendar as an axis. Bring revenue in as sales by Sale Date, and our new measure as sales by Ship Date.
Note, both of these examples were done on a sales data set with over 26M rows. I saw nothing but speedy executions throughout building these demonstrations.
Summary
USERELATIONSHIP gives us new ways to work around common logic problems while keeping our table minimal in count, and concise in content. Be sure to keep this one in your back pocket for when the time to use it arises.
Our Latest Blogs
About FreshBI
Operating throughout USA and Canada, FreshBI is a boutique Microsoft Partner using Power BI to unlock the value trapped in your data so that your business can succeed.


