Give Power BI a piece of your mind
I am sure you will find some very creative business applications for using the skills below in Power BI. At its core, this blog shows how to create a way to ask the Dashboard user questions and get these questions answered, written straight back to your dataset. For this you’ll need access to Power BI, Power Automate and Office 365 (for Forms). Enjoy….
1) Create your streaming dataset in Power BI

The first step is to sign in to Power BI online and create a new workspace to host our dataset. I am going to name my workspace ‘Burning Questions’ and leave the description blank.
- Click on ‘Workspaces’ from the left-side menu
- Click on ‘Create New Workspace’
- Name your workspace and click ‘Save’
Next I need to create our Burning Questions dataset within this workspace.
- In the top left corner of the workspace, click on the ‘New’ dropdown and from the list select ‘Streaming dataset’.
- From the list of streaming options Select ‘API’
- Name your streaming dataset and then add a value type for each question you plan to ask.


You can also name your questions here to make them easier to identify later. You will notice that as you add values to your dataset, code is added to the code box.
- Turn historical analysis on. This will allow for the dataset to save historical data
- Click ‘Create’ and then you are finished creating the streaming dataset!
2) Building the questionnaire
Now we have successfully created our streaming dataset within our workspace. The next step is to create the questionnaire where we will gather the data to feed into our dataset. For this step we will be using Microsoft Forms.
- Go to forms.office.com or navigate to the Forms app from your Office 365 portal
- Select ‘New Form’
- Name your form and then select ‘Add New’ to add your first question.

You will see that you have different question type options. For my first question I will be using the ‘Choice’ option

- Type in your questions and then create the answer options below
- When you are finished creating your answer options, toggle on the ‘Required’ switch. You can also allow for multiple responses with the ‘Multiple Answers’ switch.
- Create the rest of your questions and when you are finished you can select the preview option at the top of the page to view your survey as the finished product will appear.
3) Create the data flow
The next step is to create the flow to pipe our survey responses into our Power BI dataset. For this step we will be using Power Automate (Previously Microsoft Flow).
- Go to flow.microsoft.com
- From the left-side menu select ‘My Flows’
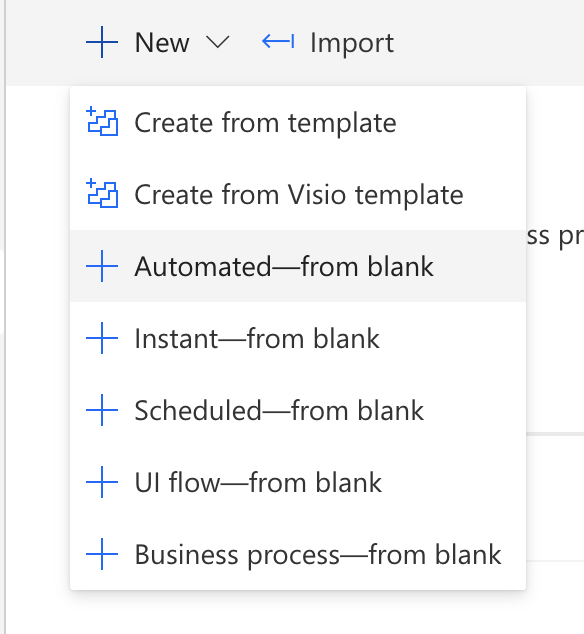
- Select the ‘New’ drop down and from the list choose ‘Automated – from blank’
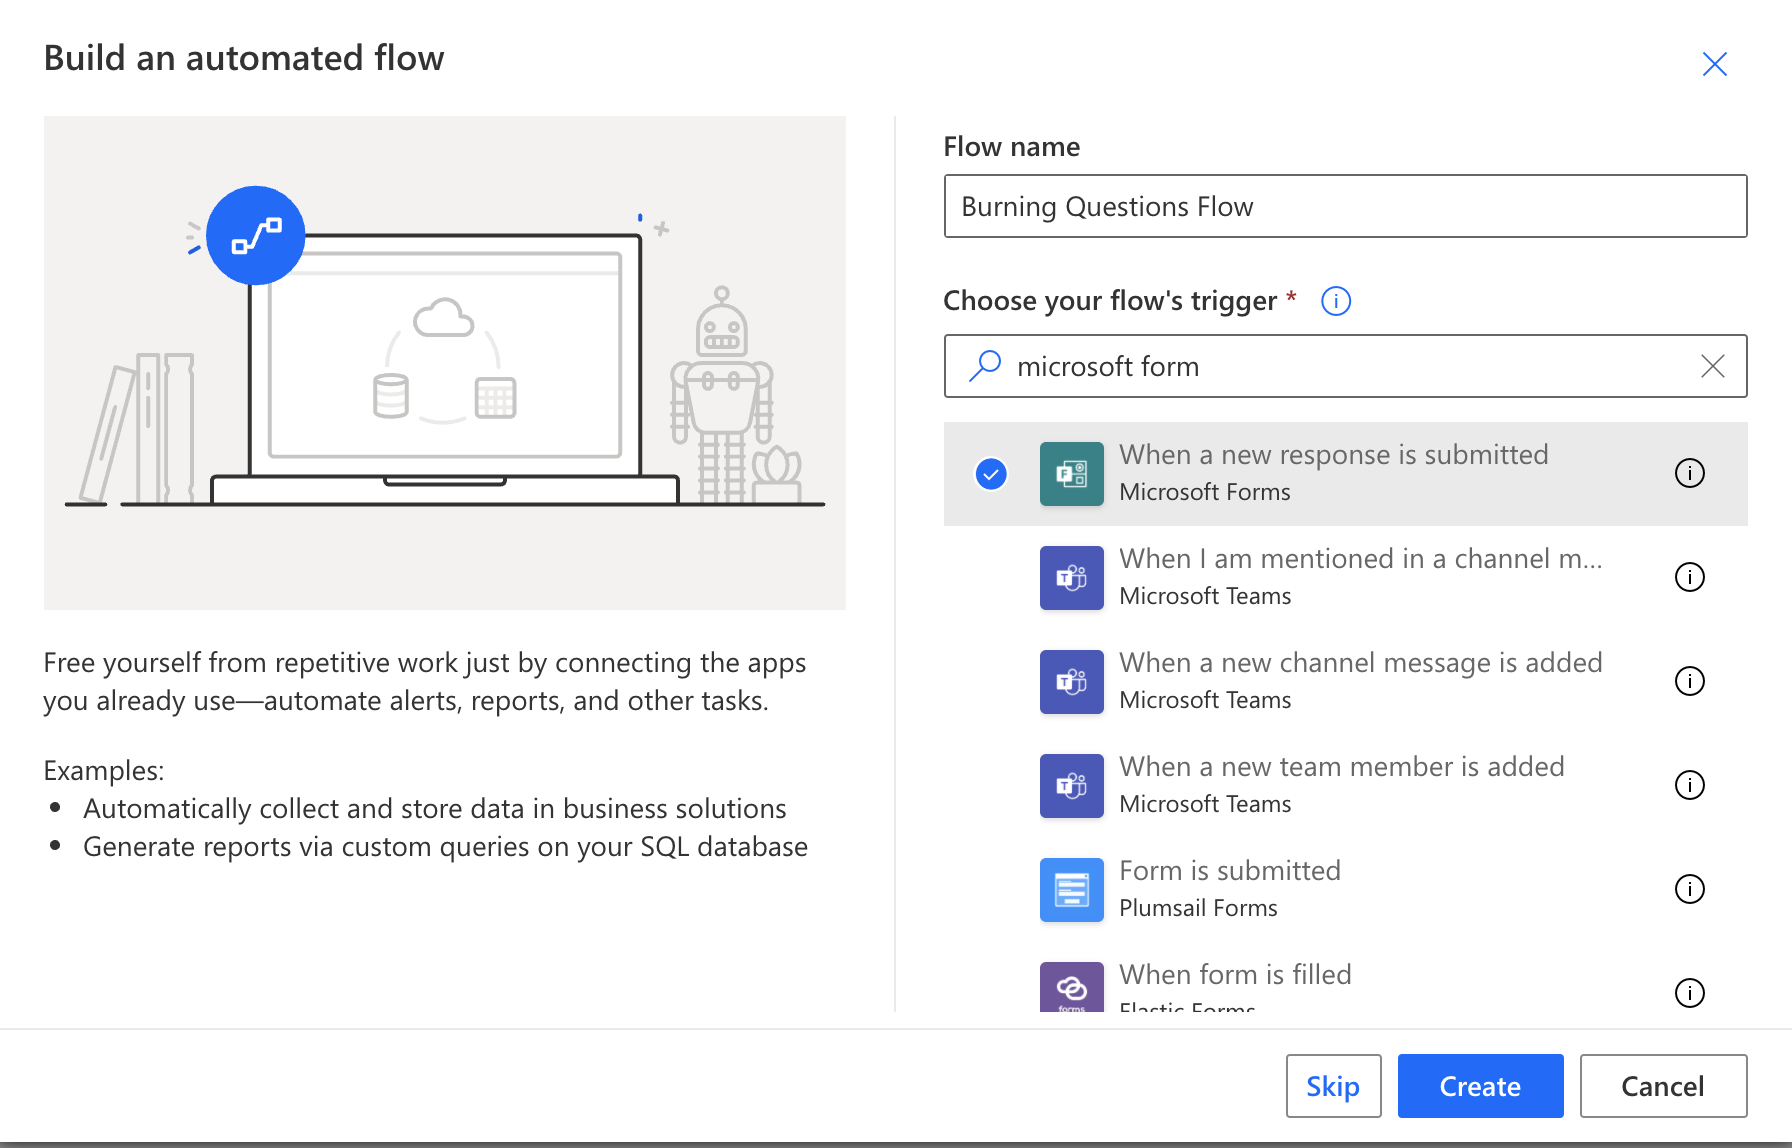
You will now need to name your flow and then select Microsoft Forms as the flow trigger.
- Search for Microsoft Forms as the flow trigger
- Click ‘Create’
Now we will set up the flow.
- From the Form ID dropdown choose your form
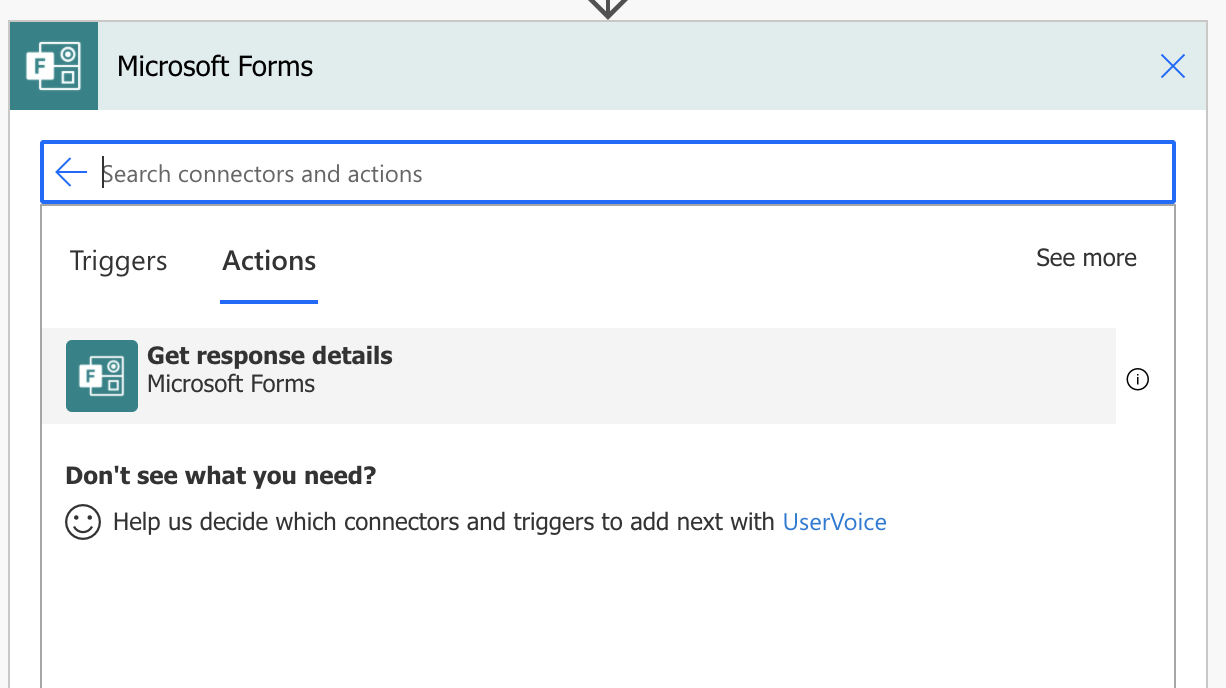
- Add a new step, search for and select Microsoft Forms and then select the ‘Get Response Detail’ option
- In the pop-up box, select the ‘List of response notifications’ option
- Add a new step and this time search for ‘Power BI” and select the ‘add rows to dataset’ option


Next you will need to select your workspace, your dataset, and your RealTimeData table.

- In the workspace section select your workspace
- In the dataset section select your dataset
- In the table section select the RealTimeData table
- You will then add each survey response to the appropriate value box (this is why it is helpful to name the values you create in the Power BI dataset).
When you are finished with the last step, click the ‘Save’ button at the bottom of the page and your Flow is complete!
4) Create your Power BI report visuals
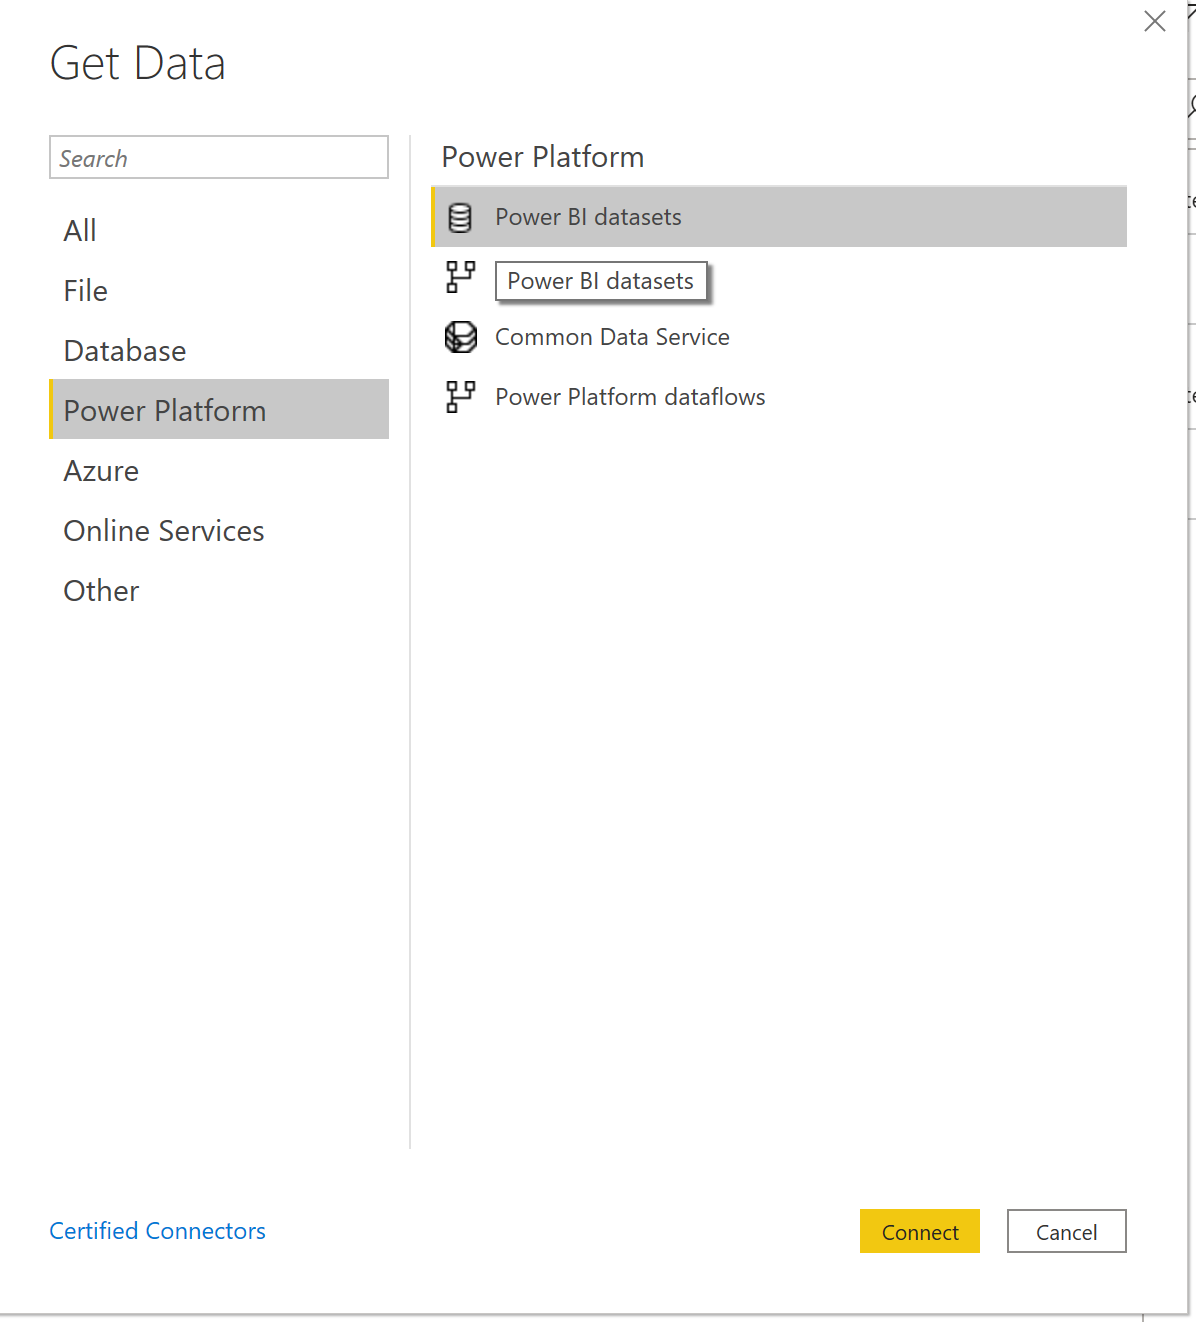
Next we will connect to your streaming dataset in Power BI and then you will be able to create your visuals in Power BI.
- Open up Power BI Desktop
- Select ‘Get Data’ and choose ‘Power BI Datasets’
- Choose your Power BI dataset
- You will now see your dataset on the right side of your screen in the Fields pane
Once you have created the visuals you want, publish your report to the Power BI workspace you created.
5) Using the real time visuals
At this point you have many options, First, you could use your Power BI report as is. Perhaps embedding it into a website alongside the embedded survey so that users can see their results in real time. Another option would be to create a Power BI dashboard, pin all of your visuals to that dashboard, and then embed the survey directly onto the dashboard.
Let’s quickly discuss how to set up option number 2. You will first navigate to the published report in your Power BI workspace. To pin each visual, select the pin icon in the top corner of each visual (you will have to hover over it for it to appear). When you pin the first visual, it will ask you to which dashboard you want to pin it. You will need to select a new dashboard if you don’t have one created already. For each subsequent visual then you will pin it to that same dashboard.
Here is how my dashboard looks after I have pinned my created visuals:

The final step then is to embed your survey on the dashboard. To do this you will need to navigate back to the Microsoft Form you created.
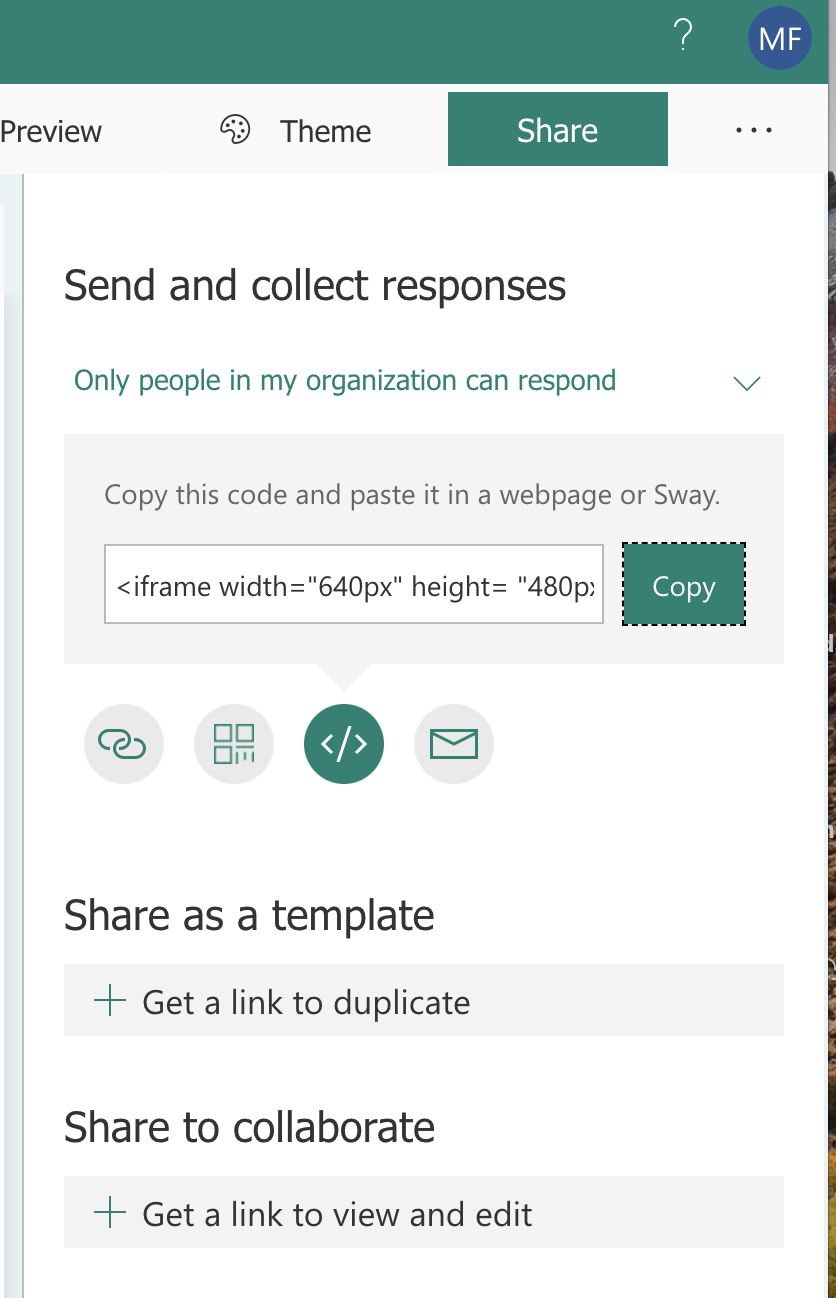
- In the top right corner click on the ‘Share’ button and then choose the embed icon
- Copy the iframe code that is generated
- Go back to your dashboard and add a tile
- Choose the web content option and then paste the copied code into the ‘Embed code’ text box. When you are finished click ‘Apply.’
- Back on your dashboard you can now resize and move the embedded survey where ever you like.
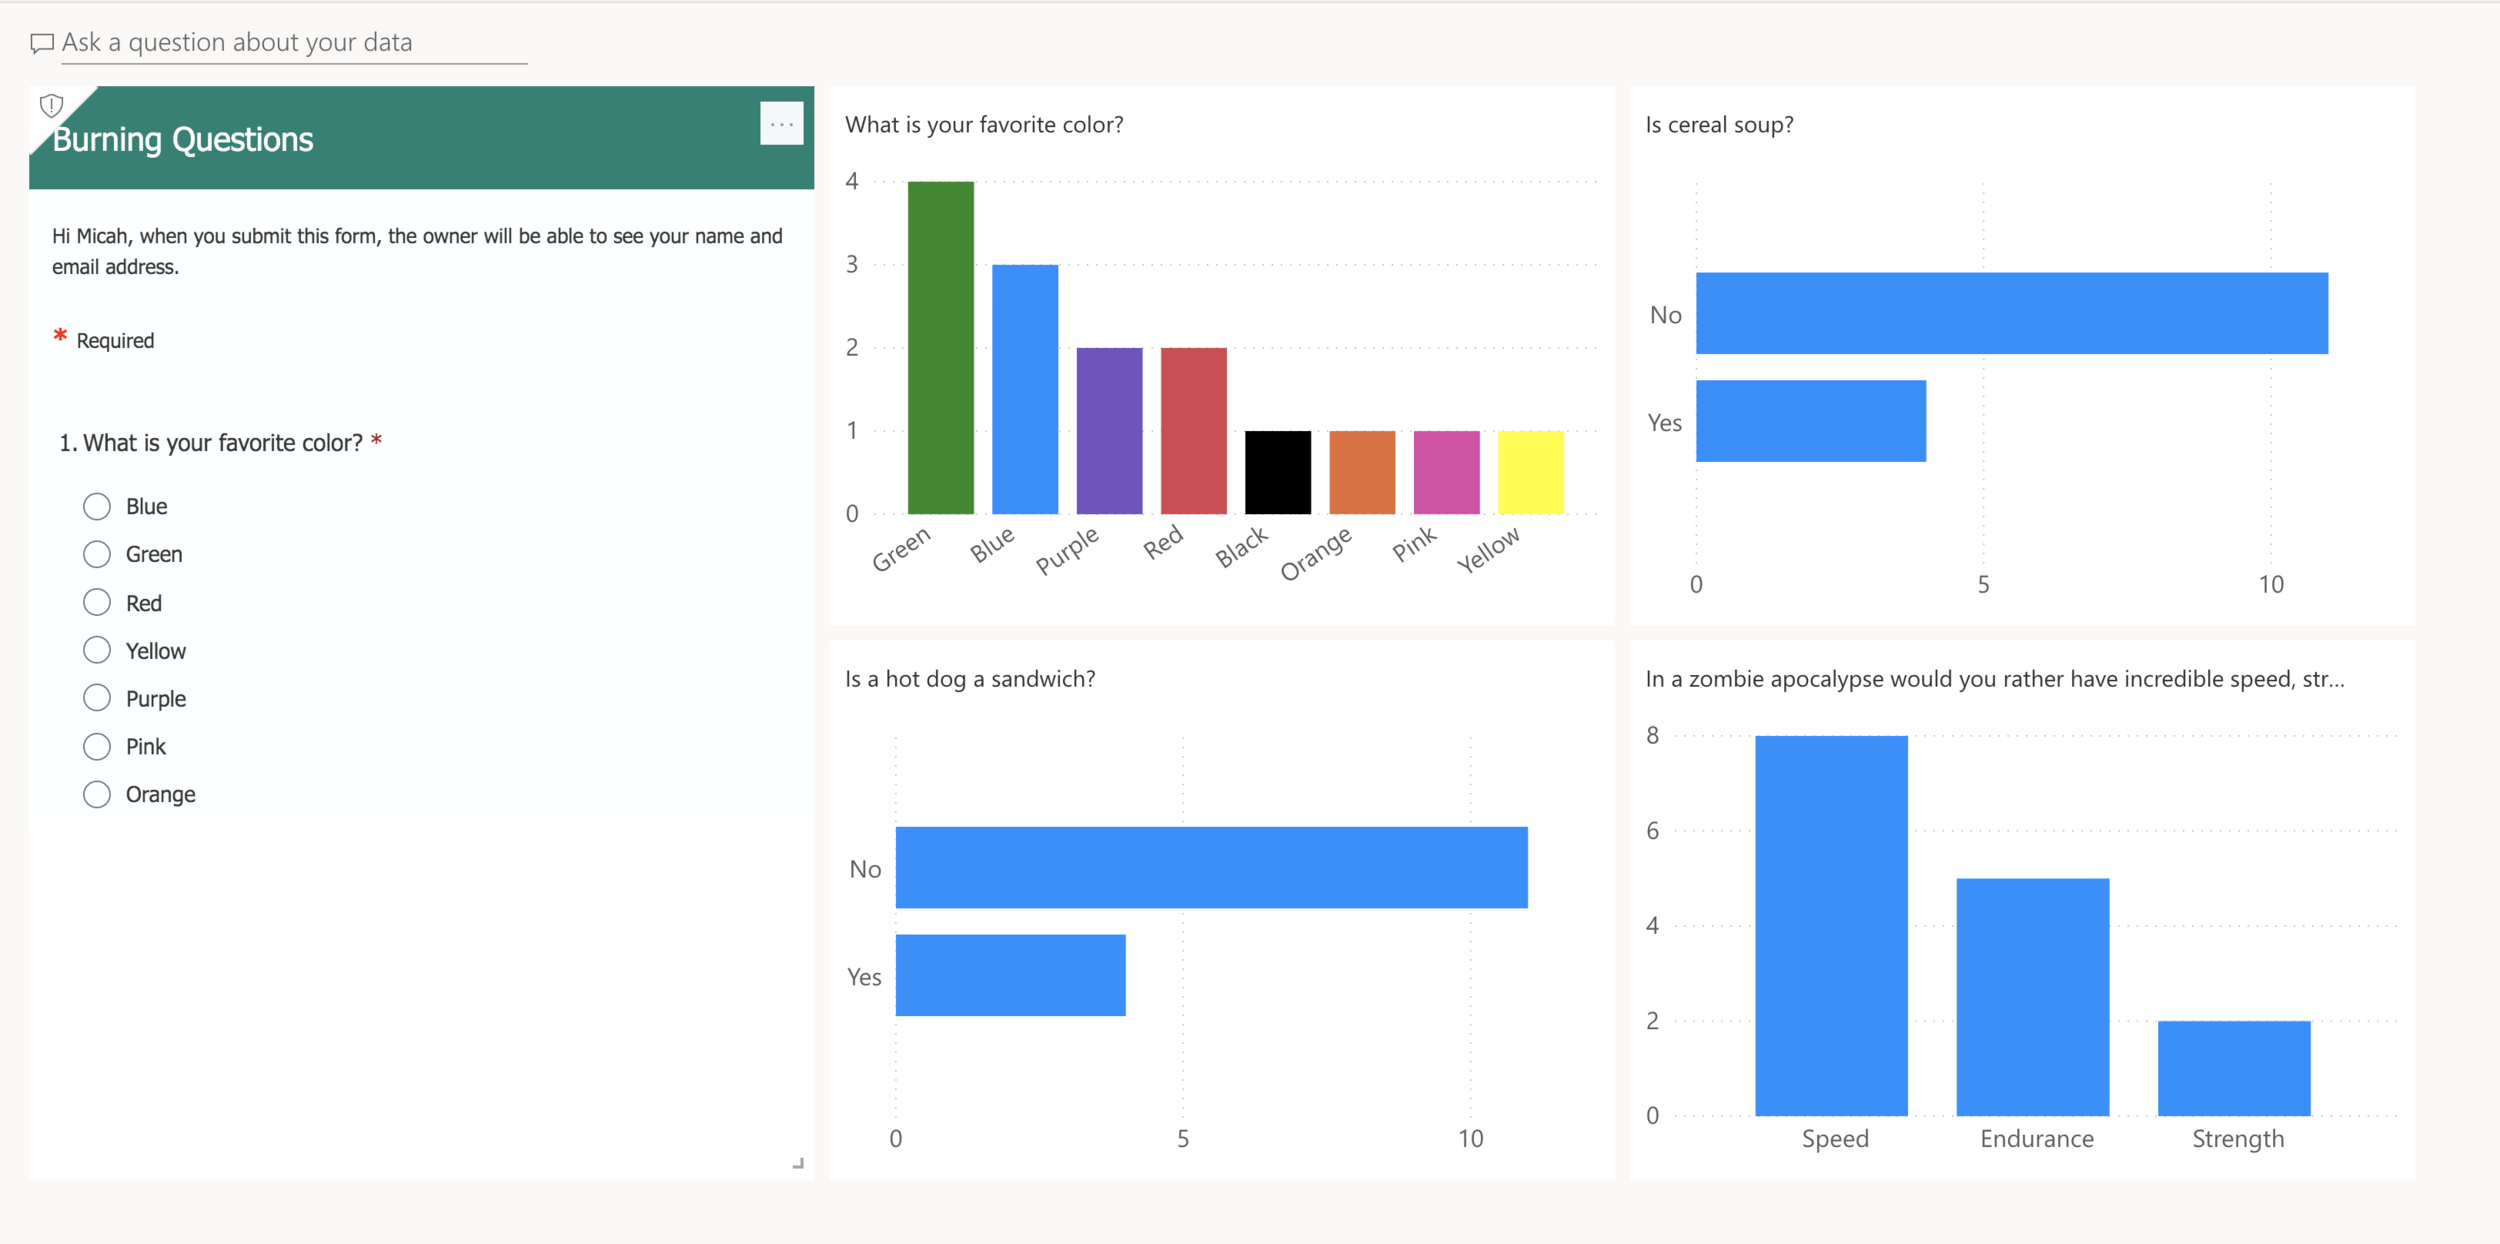
Here is the final product:
Next Level Business Intelligence
Hopefully this blog has stimulated your thinking about how to take your BI to the next level: from consuming information to taking automated action based on real-time events.


