
Unlocking DAX Measures in Calculated Columns

DAX Measures are fundamentally different from calculated columns. They allow the user to aggregate and manipulate data in ways that calculated columns can not. What if there was a way to get the attribute like functionality of a calculated column, with the flexibility of a measure? Well there is!
Using a DAX measure as an attribute can solve problems that calculated columns could not. We’re going to show you how to do it.
What Can This Technique Add to My Reports?

Work Around Visual Level Filters Limitations
Often you want to remove certain outlier values from your visual using the visual level filters. However, visual level filtering parameters can be too restrictive, especially if you are working with a lot of data points. Adding a measure as an attribute can help you work around this.

Count Row Occurrences
You may have instances where you need to know how many times a specific row of data occurs in a table. Using a measure to count these and then assigning it as a column is an easy way to do this and be able to filter your data accordingly.
Now that we’ve covered the pros we’ll look at some examples. But before we dive too deeply into how to do that it is important to first understand the difference between a measure and a calculated column.
Measures vs. Calculated Column
A calculated column is calculated row-by-row and is stored in memory.
For example, say I have a table of stocks that I have bought and sold. I can calculate my profit with DAX by using a simple calculated column. Notice that this new column is calculated row by row.


On the other hand, measures are used to calculate aggregates such as sums or averages in context and are not stored in memory.
For example, let’s say we now wanted to calculate the sum of all profits for the Water Supply industry. Here is a DAX measure I could write to accomplish that:

As you can see, this measure is applying the evaluation context (in this case Stock Industry = Water Supply) to the Stock Data table and returning the proper aggregate of the data.

Now that we understand the differences between calculated columns and measures we will now look at how to create a measure and then assign the value of that measure to a column. This allows us to use that measure as an attribute which can be quite useful. Let’s take a look at a couple of examples where this may prove to be useful.
Example 1 - Counting Row Occurrences

Let’s say I have a combined table of employees that is coming from multiple databases. Each employee has an ID number; however, some employees have been unknowingly assigned different IDs in the different databases.
I want to identify these employees with multiple IDs and list them out so that I can rectify this at the source.
Step 1: Create a unique key to differentiate between employees.
Let’s use First Name, Last Name, and Email. I will create this key by creating a calculated column that combines these fields.


Step 2: Create a measure that counts the number of times each employee-specific key is found in this combined dataset.

Step 3: Set the measure as an attribute by creating a new column and assigning it the value of our newly created measure.


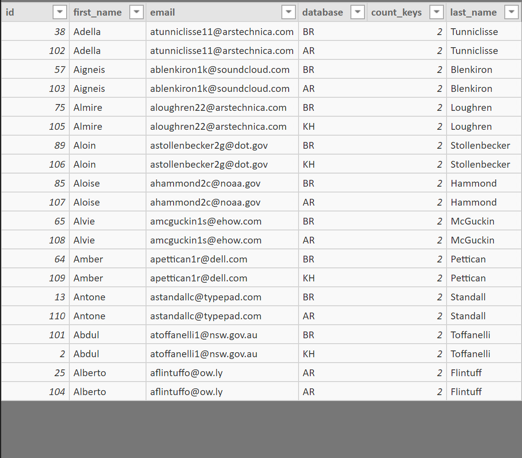
As you can see, all of the employees with multiple IDs will have a count of 2 or more in the new Employees with Multiple IDs column. All employees with an ID count of 1 are fine and do not need to be worried about.
Now I can create a new table that is identical to the first table, but that only brings over the employees with more than 1 ID. This is done by selecting the columns from the original table I would like to use, as well as specifying that [Count Keys] > 1.

Example 2 - Filtering Outliers From Visuals
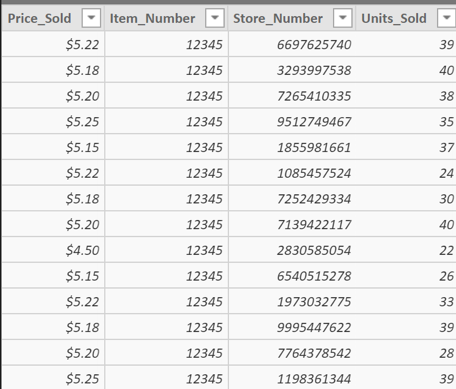
In this example, a company has a sales data table of items that they sell across multiple stores.
You can see that they have data that shows the price an item was sold at, the store it was sold at, and how many total units were sold.
This company wants to identify and visualize for a specific product, in this case Item #12345, which price point sells the most product.

The company creates a clustered column chart visual showing the number of units sold for Item #12345.
As you can see there are some outlier values (perhaps a store-specific promotion price or mislabeling) that widen the whole visual and make it unappealing.
A visual level filter won’t work here because the available parameters are too limited and greater than/less than would still include some unwanted values.
However, we can assign an attribute to each price point based off of a count. Let’s take a look at how to do that.
Step 1: Create a measure that counts the number of times the item is sold at each specific price.
Similar to our first example, we will need to use a measure to count each sale of Item #12345. We will call this measure Count Price.

Step 2: Add a column that references this newly created attribute

We’ll call this new measure Count of Price and set it to equal the Count Price measure we just created.
This new Count of Price column provides us with the number of times each item was sold at that specific price.


Step 3: Add a visual level filter
We can now add a visual level filter that limits the price points that Item #12345 was sold at to show only those that it sold at at least 15 times.
This will help us remove those outlier values without us having to use a range of prices which would have removed some of our outliers but not all without also removing price points that we wanted to retain.
Final Product:

As a result, we are left with a much cleaner visual this is easier to read and gather insights from.
Limitations:
It is important to keep in mind some size limitations with using this technique. Due to the fact that calculated columns are stored in memory, assigning a measure that is aggregated at the time of your query to a column will require a lot more processing power. I would expect to run into some data speed issues as you approach 1 million rows of data.
Our Latest Blogs


About FreshBI
Based in Canada, South Africa and in the United Kingdom, we have helped hundreds of businesses achieve excellence & success through business intelligence.
Power BI runs in our blood, and we are ready to take your business to next level.