
Construction Console

Solving Some of the Information Challenges for Construction Companies:
This Construction Console is a Power BI Dashboard aimed at overcoming some of the information challenges faced by companies in the construction industry.
With unpaid work, unfavorable payment terms, profitability measurement, project delays and technology adoption all major challenges stacking up against construction companies, this dashboard is an adoption of a technology that provides executives with real-time analytics in these key areas.
The front page offers an aggregate for each project in three key areas of operation:
Bonding Review: Offers a real-time pulse on profitability across projects.
Cash Flow: Shows Cash In & Out and surfaces the 90-day projection on cash position by Project.
Job Status: Reveals how well projects are progressing and alerts to any expected project delays.
All of these features are built into one slick dashboard in Power BI.
Key Features:
Project Drill Through:


The Construction Console has a few key features, one of these is the ability to drill into any project in any of the visuals on the main dash. You can isolate a project and view the component transactions of Bonding Review, Cash Flow and Completion Date history in just three clicks.


Project Timelines:
The Construction Dash’s Project Timelines and Job Status visuals give you a clear view of your project’s changing completion dates and exactly what the expected financial impact of project delays are on your business. This is an area of analytics that project managers gain a great deal from in their daily activities because in addition to financial indicators, this section offers project status information also relevent to enhancing partner service.
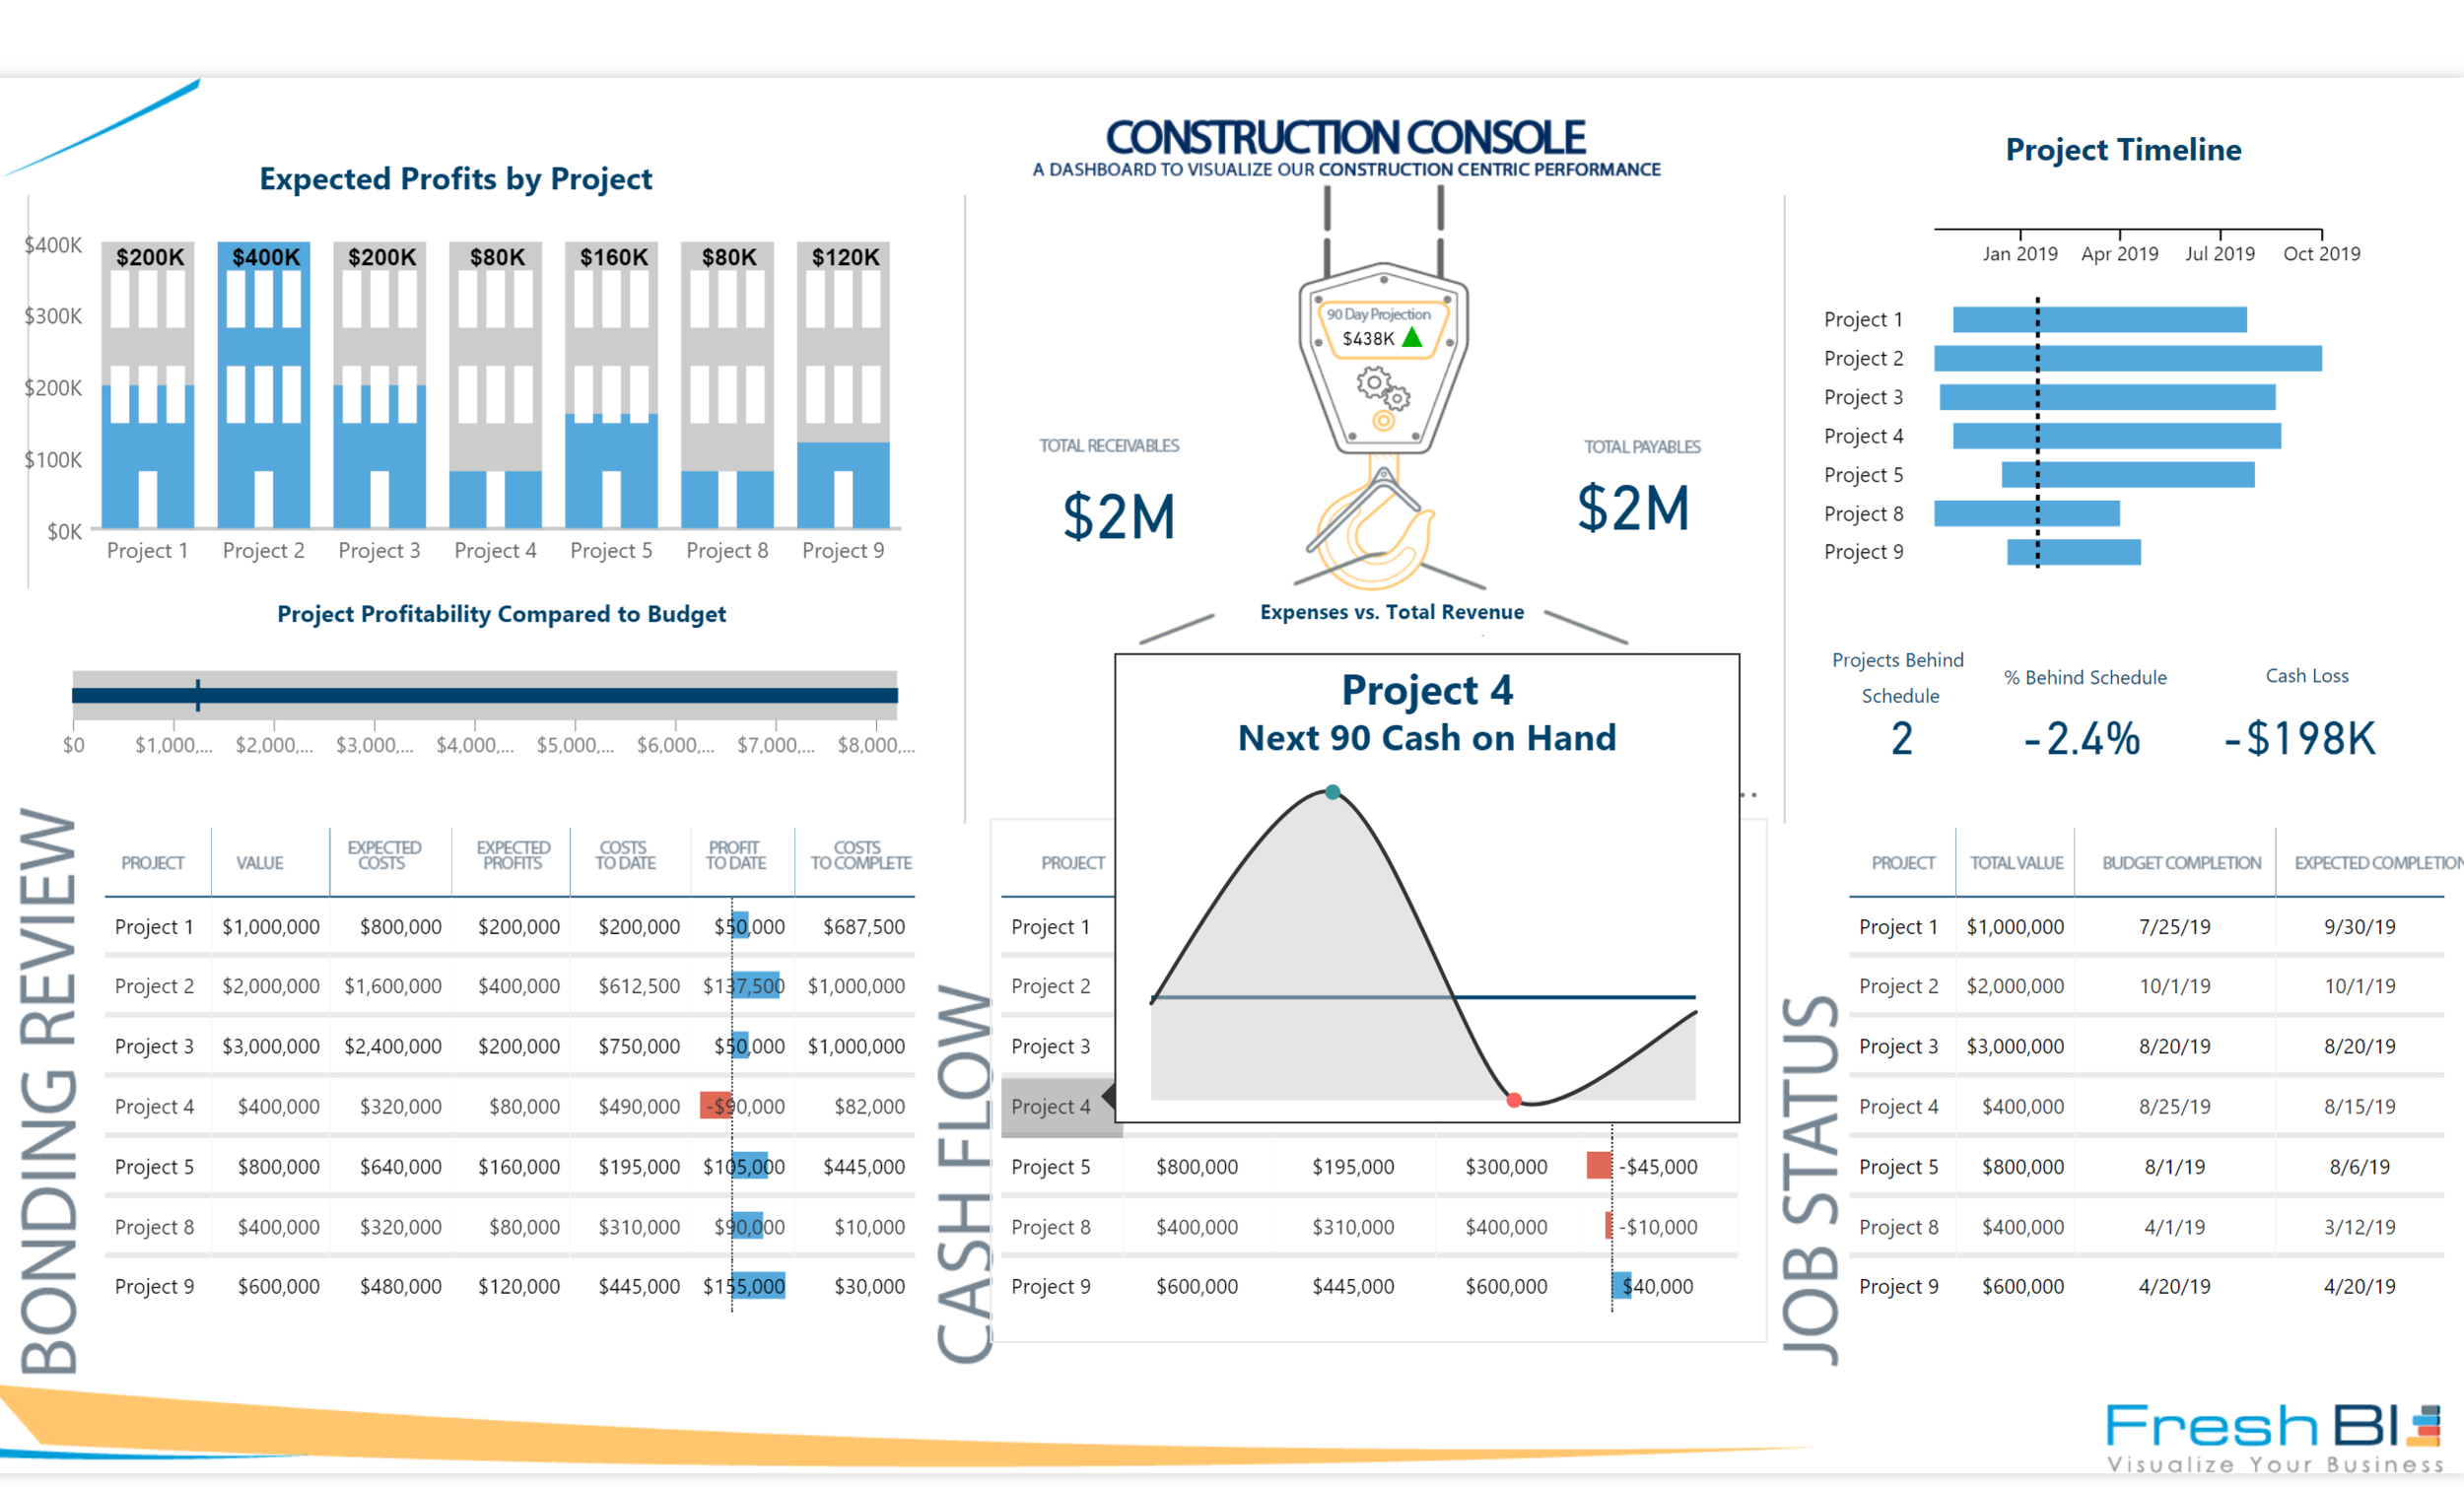
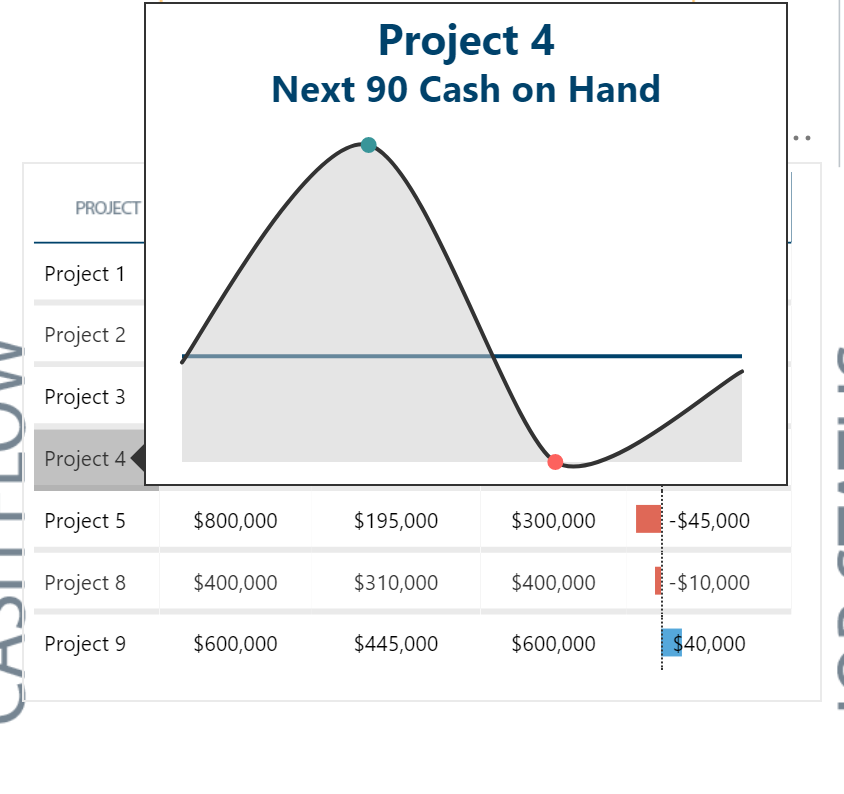
Tool-Tips:
The Construction Console makes one of Power BI’s key features available to you - Dashboard Tooltips. Dashboard Tooltips are designed to maximize your dashboard real estate through enriching data points on your dashboard by invoking a pop-up tooltip that emulates another dashboard to further explain the data point in question. In this case the tooltip shows the expected cash on hand for a given project for the next 90 days.
Grab the Wheel and Give it a Test Drive Below:
Full screen view available here>>
Our Latest Blogs


About FreshBI
Based in USA and Canada, we have helped hundreds of businesses achieve excellence & success through business intelligence.
Power BI runs in our blood, and we are ready to take your business to next level.